NEW FEATURE: Search for Monitoring Data by Sub-Basin
March 2, 2018
One of the exciting things about DataStream is watching it grow and evolve over time. Not only are more datasets coming online, but we are continually making it better thanks to the thoughtful feedback we get from DataStream users.
Now, by popular demand, you can filter your search for monitoring data within the sub-basins of the larger Mackenzie River Basin. This is so important because it allows communities to view and compare data across shared waterways.
What are sub-basins?
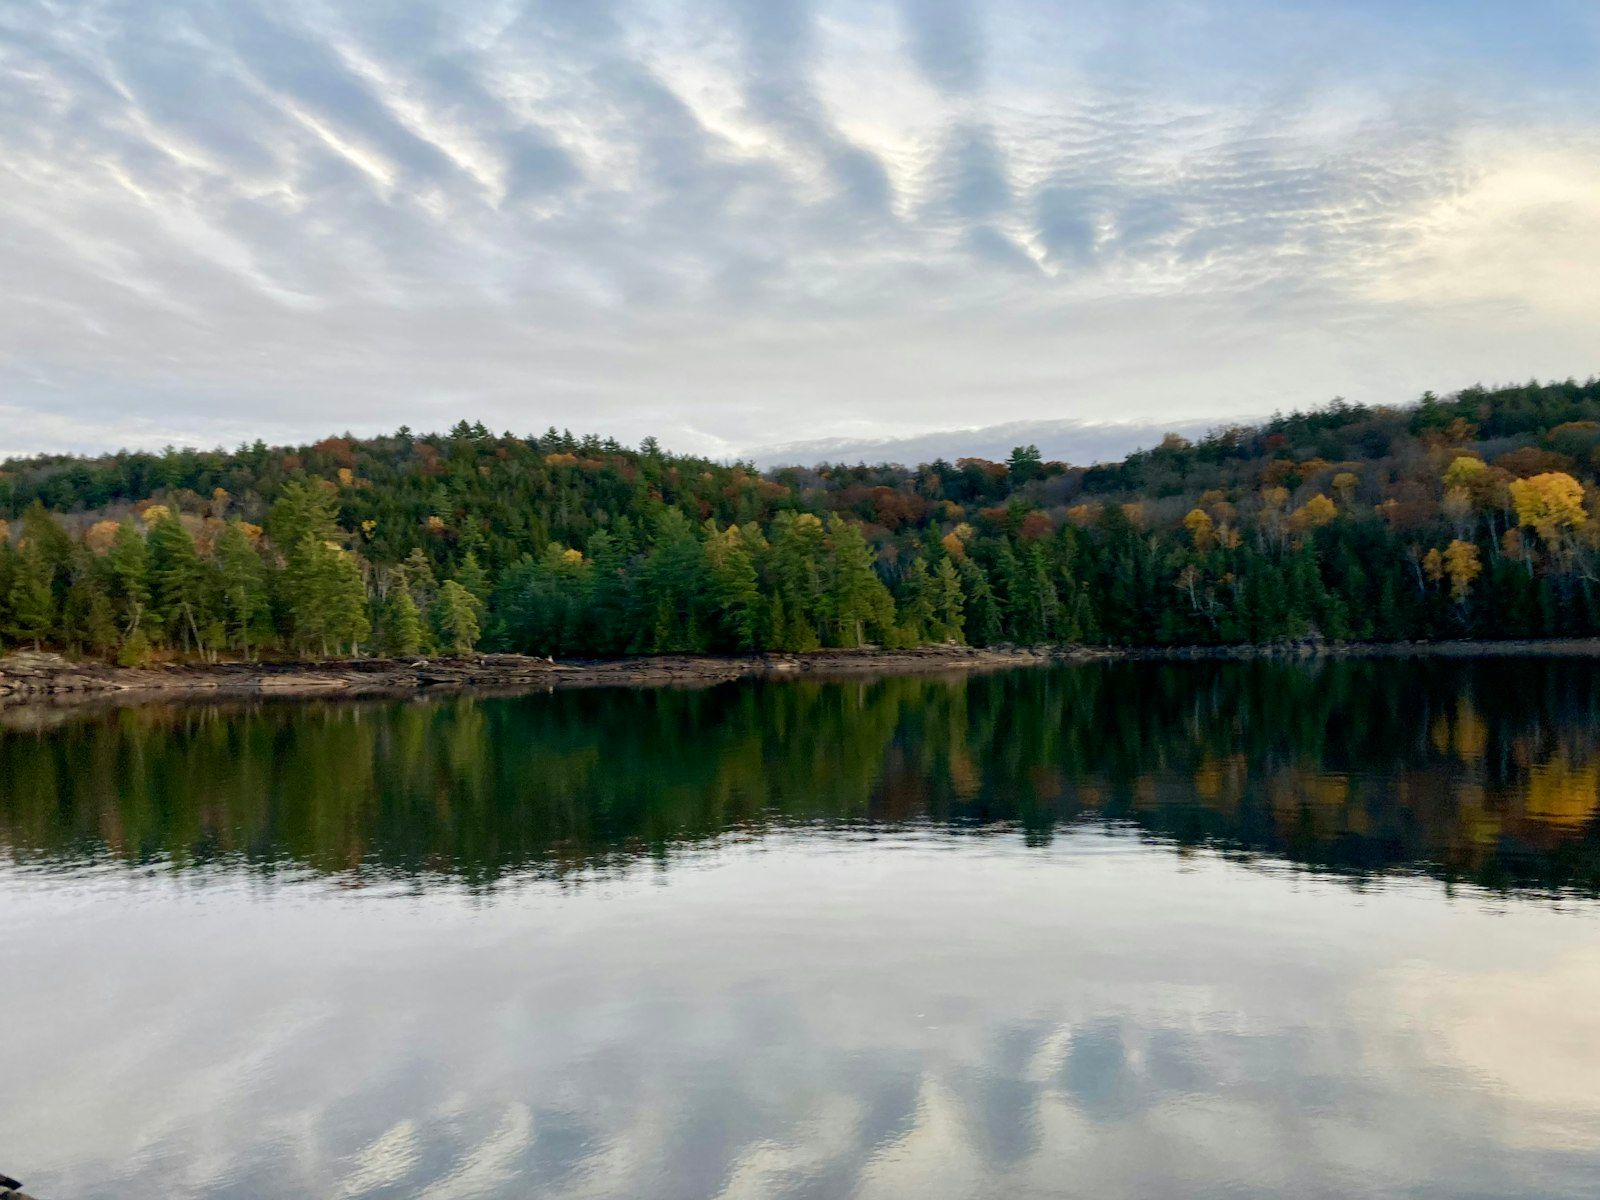
Every waterway has a drainage basin — the area of land that contributes water to a stream, river, or other waterbody. Most rain and snowmelt in a drainage basin will eventually make its way to a main river, like the Mackenzie, and flow out to the Ocean.
Within the Mackenzie Basin, which spans 20% of Canada’s landmass, there are 7 sub-basins: The Liard, Peace, Athabasca, Great Slave, Peel, Mackenzie, and Great Bear.
How to search by sub-basin
- From the search page, click on the downward arrow in the search bar and select “Filter by Sub-Basin” to choose your sub-basin of interest.
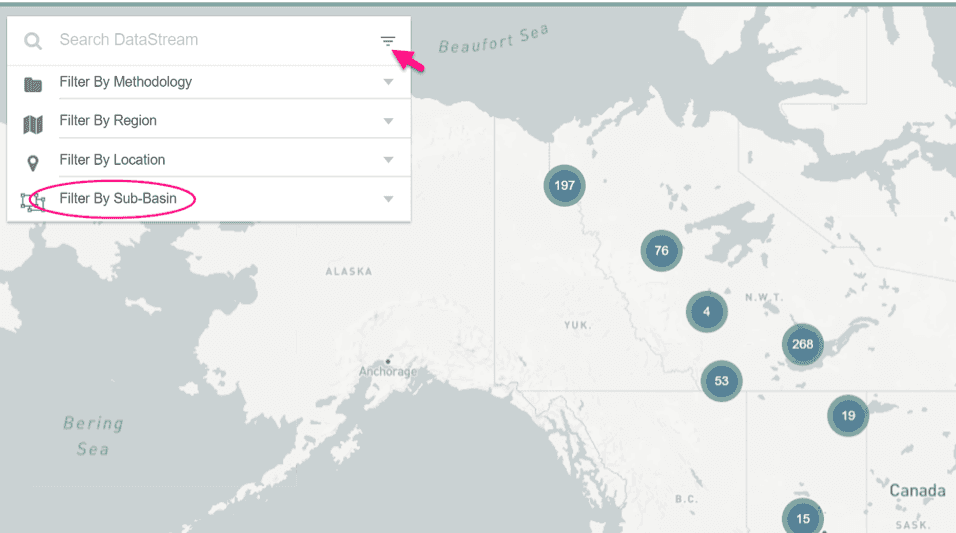
You can also add the sub-basins as a layer to the map.
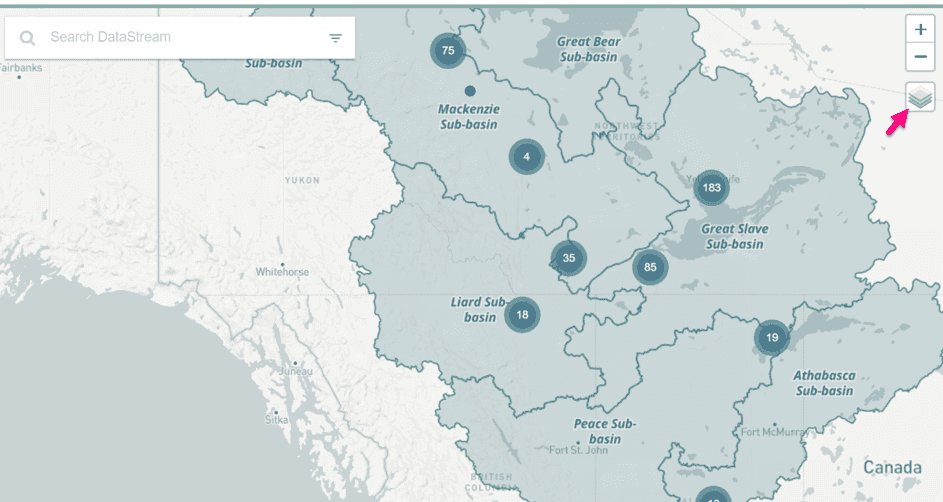
2. Once you filter your search by a sub-basin, you’ll see a list of the datasets that contain monitoring results from sites within that sub-basin.
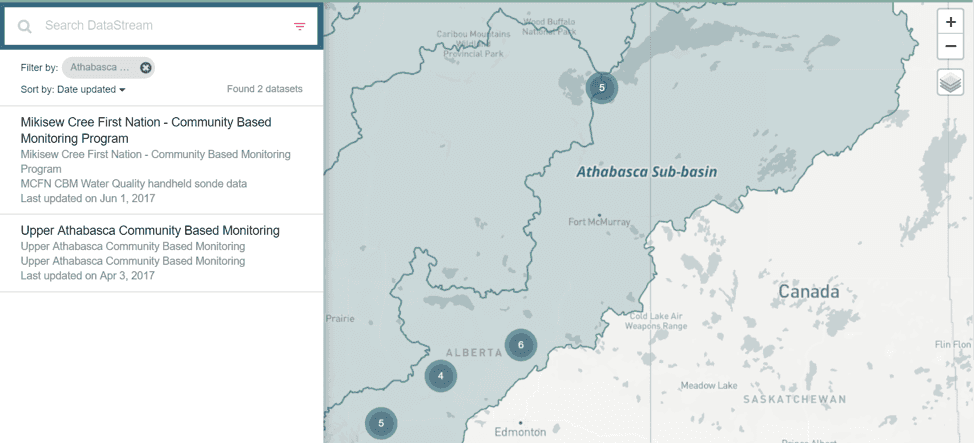
3. To explore the data, click through on one of the datasets. You’ll find the dataset details, such as information on the monitoring program and list of sampling sites, via the panel on the left.
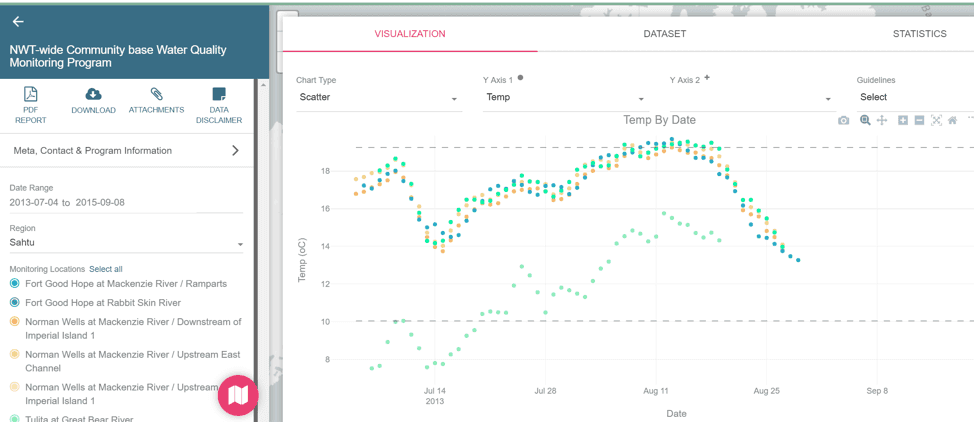
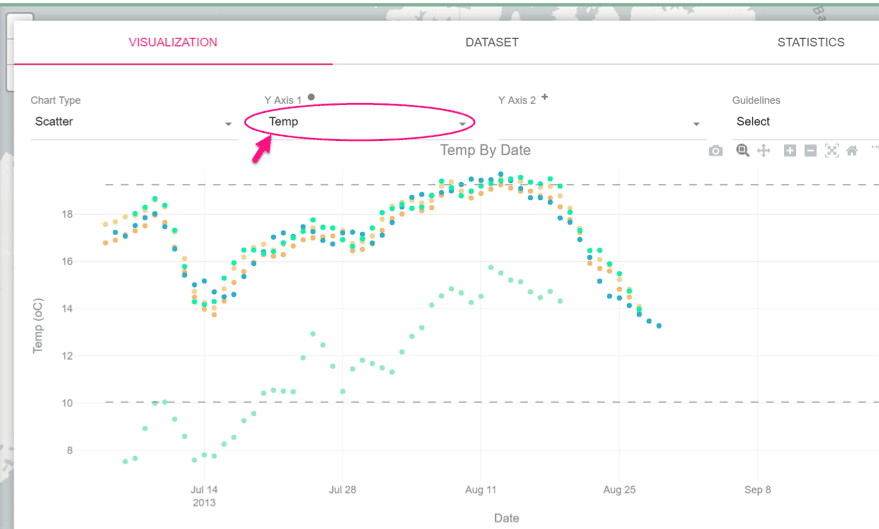
4. Through the visualization tool, you can select which parameter you want to view.
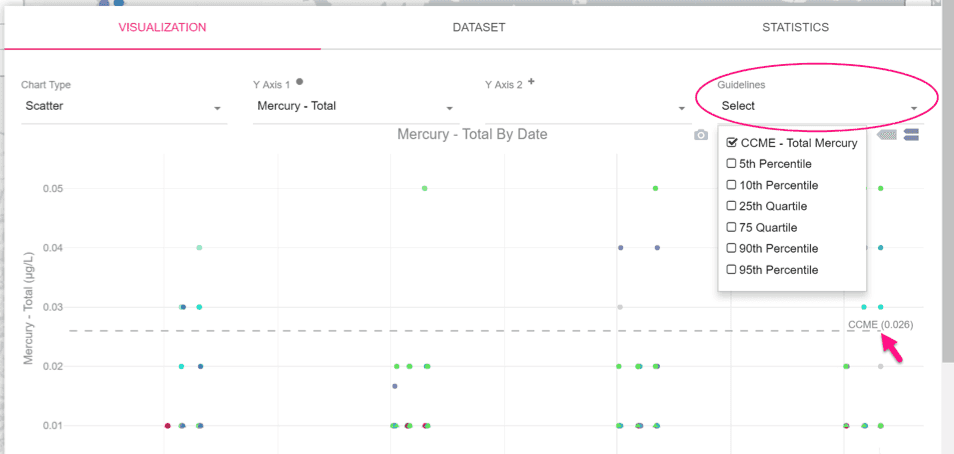
5. And where CCME Canadian Environment Quality Guidelines exist for a parameter, you can include these in the visualization using the dropdown menu on the right.
Our thanks to the Canadian Internet Registration Authority for supporting this work.
Stay tuned for more updates and user-guides coming soon!
The results are in! DataStream's 2023 external evaluation
We asked for your feedback, and you delivered! DataStream is pleased to share the results of our 2023 external evaluation.
Job Posting: Executive Director
The Executive Director (ED) will play a pivotal role in leading DataStream at an exciting time of growth.
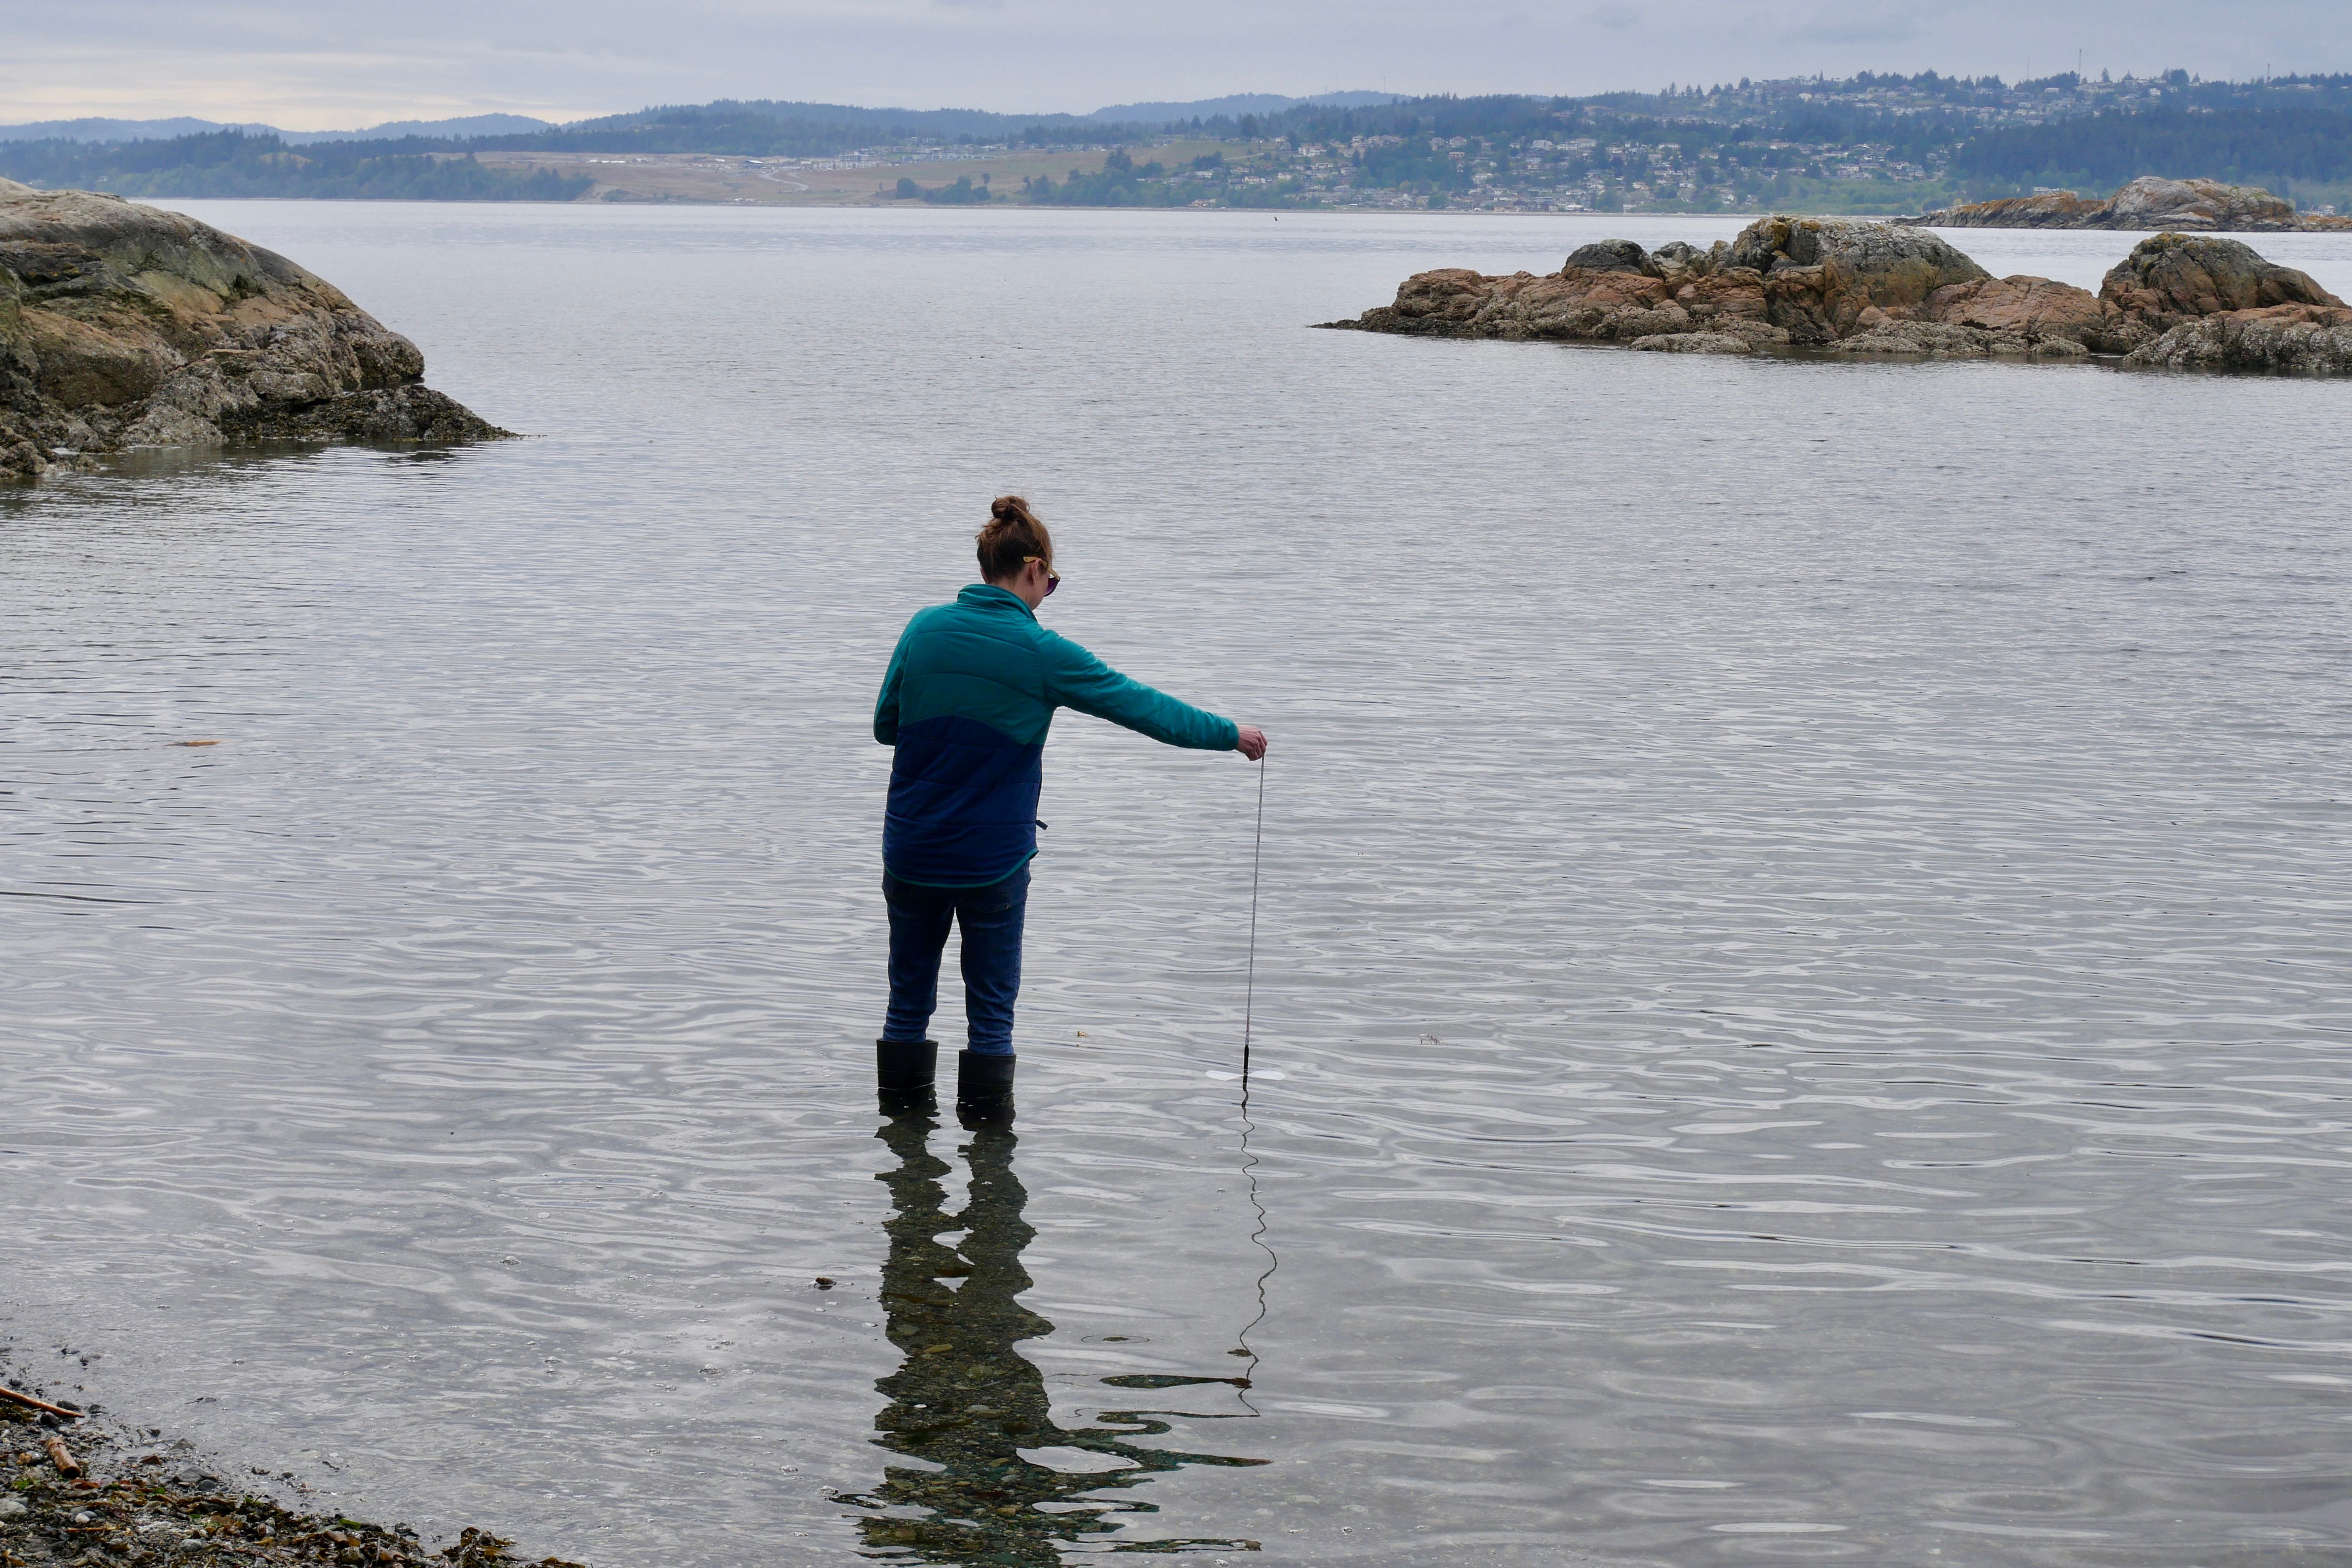
Join DataStream's Pacific Data Drive
Do you collect water quality data in British Columbia or the Yukon? If YES, we want to work with you!